Reporting
UltraCart Reporting: Tools and Scheduled Reports
Navigate: Main Menu → Operations → Reporting
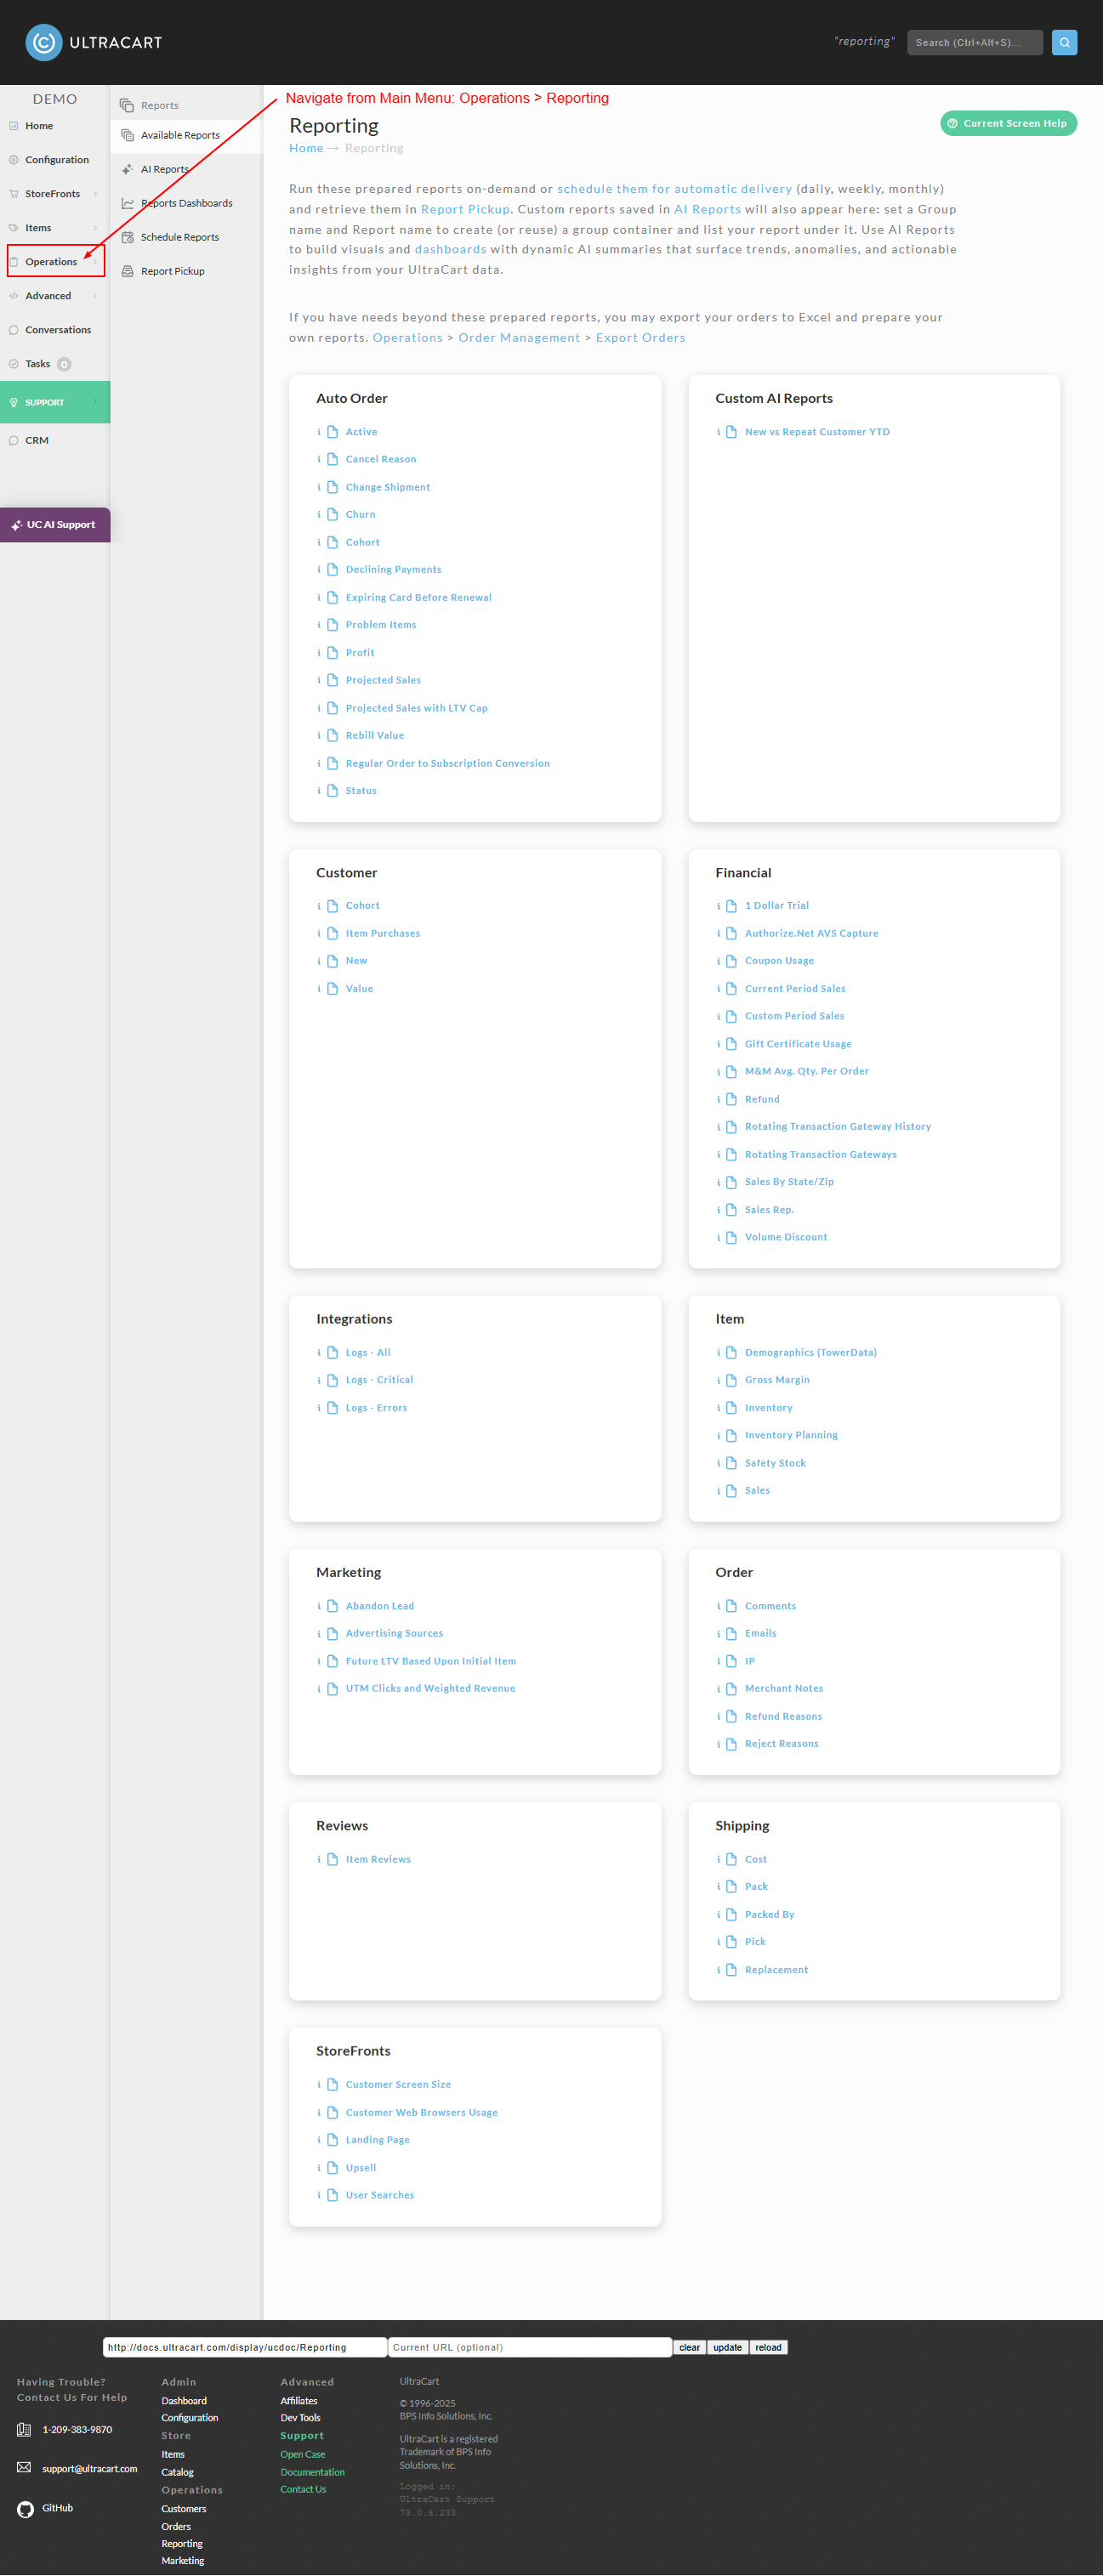
Reports Menu
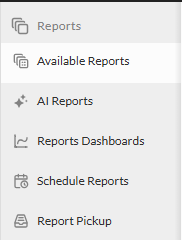
The reports menu consists of the following selectable options:
-
Available Reports
-
AI Reports
-
Reports Dashboards
-
Schedule Reports
-
Report Pickup
| Section | Description | |
| Auto Order Reports | Description |
|---|---|
| Active Report | The Active Auto Order Report provides a comprehensive overview of your current auto order subscriptions within a specified period. This report helps businesses monitor the health of their active subscriptions, identify issues, and track key metrics such as active, paused, and canceled subscriptions, as well as new sign-ups within the reporting timeframe. |
| Cancel Reason | The Cancel Reason Report provides a three-tab analysis of auto order subscription cancellations. It helps businesses understand cancellation trends and their financial impact by detailing metrics such as cancel count, average rebill count, and lifetime value across various cancellation reasons. |
| Change Shipment | The Change Shipment Report is a two-tab report designed to track and analyze modifications made to auto order shipments. It includes a "Day of Month" tab for summarizing changes by day and a "Details" tab providing granular data for each shipment adjustment, such as the auto order code, original order ID, and a log message describing the change. |
| Churn | The Churn Report is a multi-worksheet tool designed to analyze customer churn for auto order subscriptions. It helps businesses track the rate at which customers discontinue their subscriptions and provides insights to improve retention strategies, offering both an overall summary and detailed breakdowns by individual subscription item. |
| Cohort | The Cohort Report provides an in-depth analysis of auto order subscriptions, featuring a Summary Sheet with key metrics like total and active customers, revenue, and average lifetime value (LTV) after 100 days. For each subscription item, it offers Cumulative, Monthly, and Churn views, tracking cohort-based metrics such as LTV, rebill revenue, customer retention, and churn rates at specific intervals to help merchants optimize subscription performance and marketing. |
| Declining Payments Report | The Decline Auto Order Report provides a comprehensive list of all active auto orders that have experienced a payment decline on their scheduled rebill. This report is crucial for businesses to quickly identify and address payment issues, featuring details such as the original order ID, the scheduled next attempt date, and the specific reason for the decline. |
| Expiring Card Before Renewal | The Expiring Card Auto Order Report identifies auto orders with expiring credit cards on file for upcoming rebills, enabling businesses to proactively address potential payment issues. |
| Problem Items | The Problem Item Report identifies auto orders failing to rebill due to item configuration or inventory issues, helping businesses resolve operational challenges. |
| Profit Report | The Profit Report delivers in-depth financial insights into the performance of your auto-order products. It features a Summary tab that aggregates key financial and operational metrics across all items, alongside individual Item tabs for each product, ensuring consistent analysis of original orders, rebills, costs, profits, reserves, and customer activity to support informed business decisions. |
| Projected Auto Order Sales | The Projected Auto Orders Report forecasts future auto order activity based on a user-specified date range, providing insights into upcoming sales and scheduled shipments. The report includes three worksheets: "Projected Auto Orders Sales" detailing gross sales and units, "Summary by Week and Month" for aggregated sales data, and "Customers on Auto Order Report" listing individual customer and shipment details for scheduled auto orders. |
| Projected Sales with LTV Cap | The Projected Sales with LTV Cap Report offers a comprehensive analysis of the long-term value of your auto order items, providing a multi-worksheet breakdown. It includes an overall summary, an index of all auto order items, individual worksheets summarizing each item, a summary of orders sorted by ID, and a sheet detailing the rebill value for each item. |
| Rebill Value Report | The Rebill Value Report provides a detailed, month-by-month analysis of the performance and profitability of your UltraCart auto-order items over their entire lifecycle. With a dedicated tab for each item, this report tracks customer retention, net and gross revenue, and refunds, offering essential insights for optimizing recurring revenue programs and assessing long-term success. |
| Regular order to Subscription Conversion | The Regular Order to Subscription Conversion Report provides insights into how effectively one-time purchases transition into recurring subscriptions within UltraCart. Organized into "By Order" and "By Offer Order ID" tabs, this report helps businesses optimize their offers and improve long-term customer engagement by detailing conversion counts, average conversion lag, and specific order identifiers. |
| Auto Order Status Report | The Auto Order Status Report provides a real-time, comprehensive overview of all your UltraCart auto-order subscriptions. This single-tab report offers detailed information on each subscription's current status, transaction history, and associated customer data, enabling you to effectively monitor performance, identify potential issues, and manage customer relationships. |
Customer Reports
These UltraCart Customer Reports provide vital insights into your customer base and their purchasing behaviors. They allow you to analyze customers by their initial purchase cohort to understand long-term value and retention, track detailed purchase histories for both one-time and recurring orders, and identify new customers acquired within specific periods. This comprehensive reporting helps you assess customer loyalty, optimize marketing strategies, and improve overall customer engagement.
| Customer Reports | Description |
|---|---|
| Cohort Customer Report | The Cohort Customer Report groups customers by their initial purchase time period, analyzing their subsequent behavior to answer key business questions. This report helps track metrics such as Lifetime Value (LTV) for both one-time and auto-order customers, assess the profitability of marketing campaigns (e.g., Facebook, affiliate traffic), and determine customer retention rates for recurring subscriptions over time. |
| Customer Item Purchase Report | The Customer Purchase Summary Report provides a consolidated overview of items purchased by each customer within a specified time period. It differentiates between regular and auto-order sales for each item and includes detailed pages for individual items, showing sales specifics broken down by customer email. |
| New Customer Report | The New Customer Report provides a comprehensive listing of customers who made their first purchase within a specified date range. This report details each new customer's email address, the count of their orders within the period, and the individual order IDs, along with a summary at the bottom outlining total new customers, new customer orders, and their respective percentages. |
| Customer Value | The Customer Value Report provides in-depth repeat customer analysis, enabling businesses to understand customer purchasing habits and loyalty. This report allows you to view metrics such as the total number of orders a customer has placed, offering insights into their overall value and engagement over time. |
Financial Reports
These UltraCart Financial Reports offer a comprehensive suite of tools for monitoring and analyzing your e-commerce financial performance. They cover detailed sales breakdowns by period, payment method, and geographic location, alongside insights into the impact of coupons, gift certificates, and volume discounts. Additionally, these reports provide crucial data on refunds and payment gateway transaction activity, empowering you to reconcile financials, identify trends, and optimize revenue streams.
| Financial Reports | Description |
|---|---|
| 1 Dollar Trial | |
| Authorize.net AVS Capture | |
| Coupon Usage Report | The Coupon Usage Report provides a detailed breakdown of all orders where coupons were applied. This report helps businesses analyze the effectiveness of their promotional campaigns by showing how coupons are being utilized across various transactions. |
| Current Period Sales | The Current Period Sales Report offers a focused, real-time overview of your sales performance for a designated reporting period. Presented in a single tab, this report breaks down sales data by payment method, pricing tiers, item performance, coupon usage, shipping and handling, and detailed sales tax. It's an essential tool for monitoring sales trends, assessing financial health, and identifying optimization opportunities. |
| Custom Period Sales | The Custom Period Sales Report offers a highly detailed view of your UltraCart sales activities for any user-defined date range. This report provides a comprehensive breakdown of gross sales, payment methods, pricing performance, item statistics, shipping and tax details, daily sales trends, and refund information, serving as an invaluable resource for in-depth sales analysis and strategic business decisions. (See: Understanding the Period Sales reports and refund reporting) |
| Gift Certificate Usage | The Gift Certificate Usage Report offers a clear and concise overview of all gift certificate activity within UltraCart. This single-tab report tracks the issuance, usage, and current balances of each gift certificate, providing essential details like code, original balance, remaining balance, expiration date, activity description, date, and amount to help you effectively monitor your gift certificate programs and manage customer redemptions. |
| Kit Components Sold | |
| M&M Avg. Qty Per Order | The M&M Avg. Qty. Per Order Report provides a detailed analysis of sales performance for each Mix-and-Match group. This single-tab report helps businesses understand how these promotions influence order quantities and different sales types by breaking down data into retail, non-retail, and total sales, along with corresponding order counts, units sold, and average units per order. For more about Mix-And Match groups: Mix and Match Groups |
| Refund Report | The Refund Report offers a comprehensive overview of all refund activity within a specified reporting period. It is organized into two sections: a detailed list of refunds for non-rejected orders, including transaction and customer information, and a concise list of Order IDs for rejected orders that received refunds, designed to help you monitor refund patterns, reconcile financials, and maintain customer satisfaction. |
| Rotating Transaction Gateway History | |
| Rotating Transaction Gateways | The Rotating Transaction Gateway Report provides a real-time snapshot of transaction activity across your configured payment gateways for a specified period. This single-tab report helps you monitor daily and monthly transaction volumes for all, auto-order, and trial transactions, along with their respective maximums and reset times, enabling you to manage gateway usage efficiently and prevent transaction limit issues. |
| Sales By State/Zip | The Sales by State/Zip Report provides a comprehensive breakdown of sales activity for a user-specified date range, allowing analysis of specific items or all items sold. This report is organized into three tabs—Sales by Zip Code, Sales by State, and Sales Summary—to help businesses effectively analyze geographic sales patterns and overall sales performance. |
| Sales Rep Report | The Sales Rep Report provides a concise overview of sales performance for individual sales representatives over a specified period. This single-tab report helps you quickly assess each sales rep's contributions by displaying their attributed orders, subtotal, shipping, tax, and total revenue, enabling you to optimize your sales strategies and evaluate individual performance effectively. |
| Volume Discount Report | The Volume Discount Report provides a comprehensive analysis of all volume discounts applied during a specified reporting period. Organized into four distinct tabs—By Item, By Customer Profile Email, By Order, and By Item By Order—this report helps businesses assess the effectiveness of their volume discount strategies and their impact on sales and customer purchasing behavior. |
Integration Reports
These UltraCart Integration Reports provide crucial visibility into the activity and health of your system integrations. They offer unfiltered views of all integration logs, as well as filtered snapshots focusing on critical errors and general errors/warnings. These reports are essential for diagnosing issues, ensuring smooth data flow, and maintaining the stability of your integrated systems.
| Item Reports | Description |
|---|
| Marketing Reports | Description |
|---|
| Order Reports |
|---|
| Shipping Reports | Description |
| Storefronts Reports | Description |
|---|---|
| Customer Screen Size | This report provides a breakdown of the device screen size associated with each order placed during the reporting period. |
| Customer Web Browser Usage | The report provides a list of web browser families that the customer's are using when placing their orders, along with the count of each browser family, for the reporting period. |
| Landing Page | The landing page report provides insight into how visitors interact with your storefront landing pages. |
| Upsell Report | This is a comprehensive report details in the breakdown of the upsells triggered with a column for each day of the reporting period. The rows provide the following details for each days upsells: Sales Info (section) - Total Product Revenue - Total Shipping Revenue - Total Tax Revenue - Total Revenue - Total Upsell Revenue Order Info (section) - Total Orders - BEOE Orders - Auto Order Rebills - Orders Through Upsell Path - Orders With Upsells - Upsell Percentage - Avg. Revenue Products Sold (section) - = Includes Upsell Units Upsell Products Sold (section) Orders With Number of Upsells (section) Number of Orders By Path (section) |
| User Searches | This report provides a list of the user searches, with the following columns: - Description - Search Count - Average Result Count :::info ### Note This list shows you the searches that customers are performing on your website. If you see an interesting search that produced no search results, you may need to increase the content of your items so that customers can find what they are looking for. ::: |
Running a Report
Once you've found the report you need, click its name (link) to open the report form. This form allows you to define data ranges and apply various filters. While most reports only require a few fields, some more complex reports might have several options.
For example, the Current Period Sales report requires no input fields, as it automatically generates data for the current period.
Below is an example of the Sales by Zip Report form with its three fields completed.
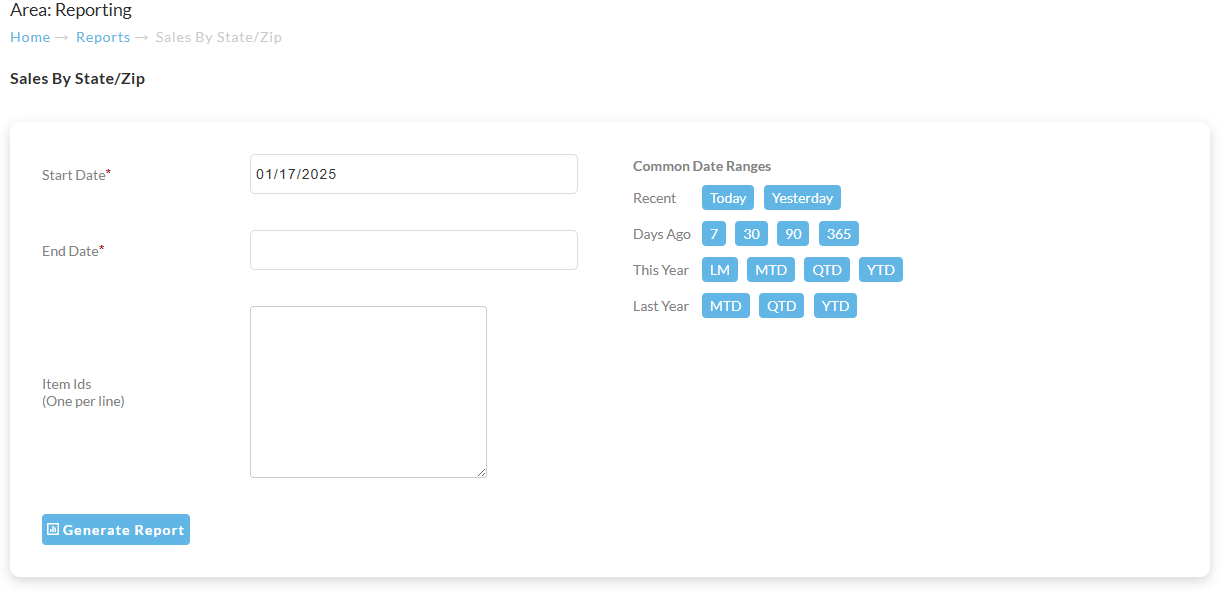
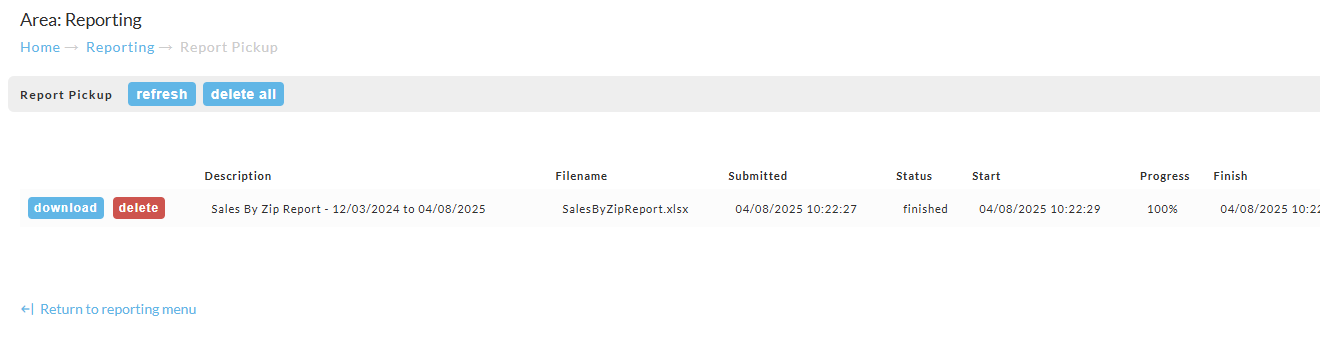
Report Pickup
Upon running the report you may encounter the following message about navigating to the report pickup area to download the completed report:
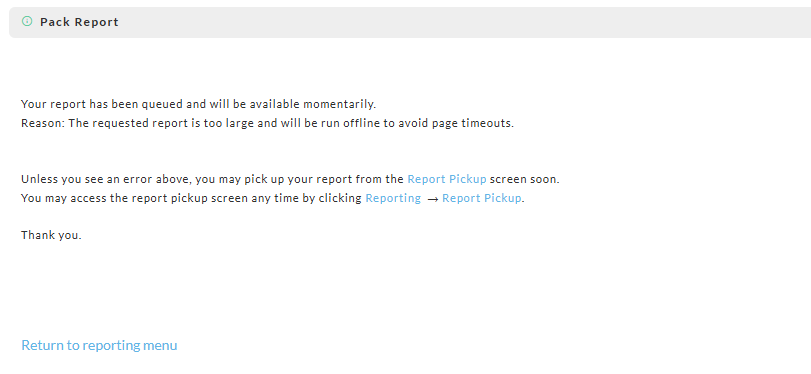
Downloading the Report from Report Pickup
Click the download button to download the report:
Frequently Asked Questions
Question: How can I get my full analytical statistic details for my account??
Answer: Your account analytical data is available in Google BigQuery. You can use the AI Report builder to help craft custom reports from your analytical data. Implementing the UltraCart Analytic tracking script, along with other tracking scripts and implementing proper UTM collection, help ensure that you are collecting full analytical data.
Question: I need a report that isn’t listed under Available Reports—what should I do?
Answer: Use AI Reports (AI Report Builder) to create a custom report by asking your question in plain English. Go to Operations → Reporting → Build Custom Reports, create a new report, and save it for reuse. For step-by-step guidance, see AI-Powered Report Builder: AI-Powered Report Builder .
Question: When I generate a report, the report contains jumbled letters and numbers, why?
Answer: Reports containing Personally Identifiable Information (PII) will display the PII details as random text and numbers, if the user has the “restrictive” user permission titled ‘Access reports without PII' enabled. To view the reports with the PII details, you’ll need to remove that restrictive user permission.
Question: Is there a report that shows customer phone numbers?
Answer: While there isn’t a specific report for customer phone numbers, multiple reports contain phone numbers, and you can also create a custom order export report with a export mapping that contains the customer phone number(s). See the Customer Item Purchase (item worksheets), Item Sales, and the general order export report (making sure the export mapping contains phone number field(s).
Question: How can I create Custom Reports in Google BigQuery?
Answer: You can configure Google BigQuery warehouse reporting tool with your UltraCart account. If you are unfamilar with Google BigQuery but would like to explore creting custom reports, please checkout the new AI-Powered Report Builder, which you can use to build custom reports by querying the AI. Learn more here: AI-Powered Report Builder
Question: I created an AI report but the info coming from it doesn't seem right, what should i do?
Answer: If it appears specific fields have ‘jibberish’ this is related to a restrictive user permission that is preventing the viewing of Personally Identifiable Information (PII), so it is replaced with the jibberish in place of the actual PII details. Edit your user and remove the user permission ‘Access Reports without PII’, then save the changes and then run the report again. If the issue is in regard to the report details themselves, you can edit the saved report and continue a dialog with the report builder, where you can ask clarifying questions or request adjustments, providing more context, such as specific timeframes, groupings (by product category, UTM campaign, etc.), or desired KPIs.