AI-Powered Report Viewer
The AI Report Viewer lets you open, inspect, and iterate on reports created with the AI-Powered Report Builder. From one screen you can see the chart, the raw data, the exact SQL, an expert AI analysis, and a side-chat to ask questions about the results.
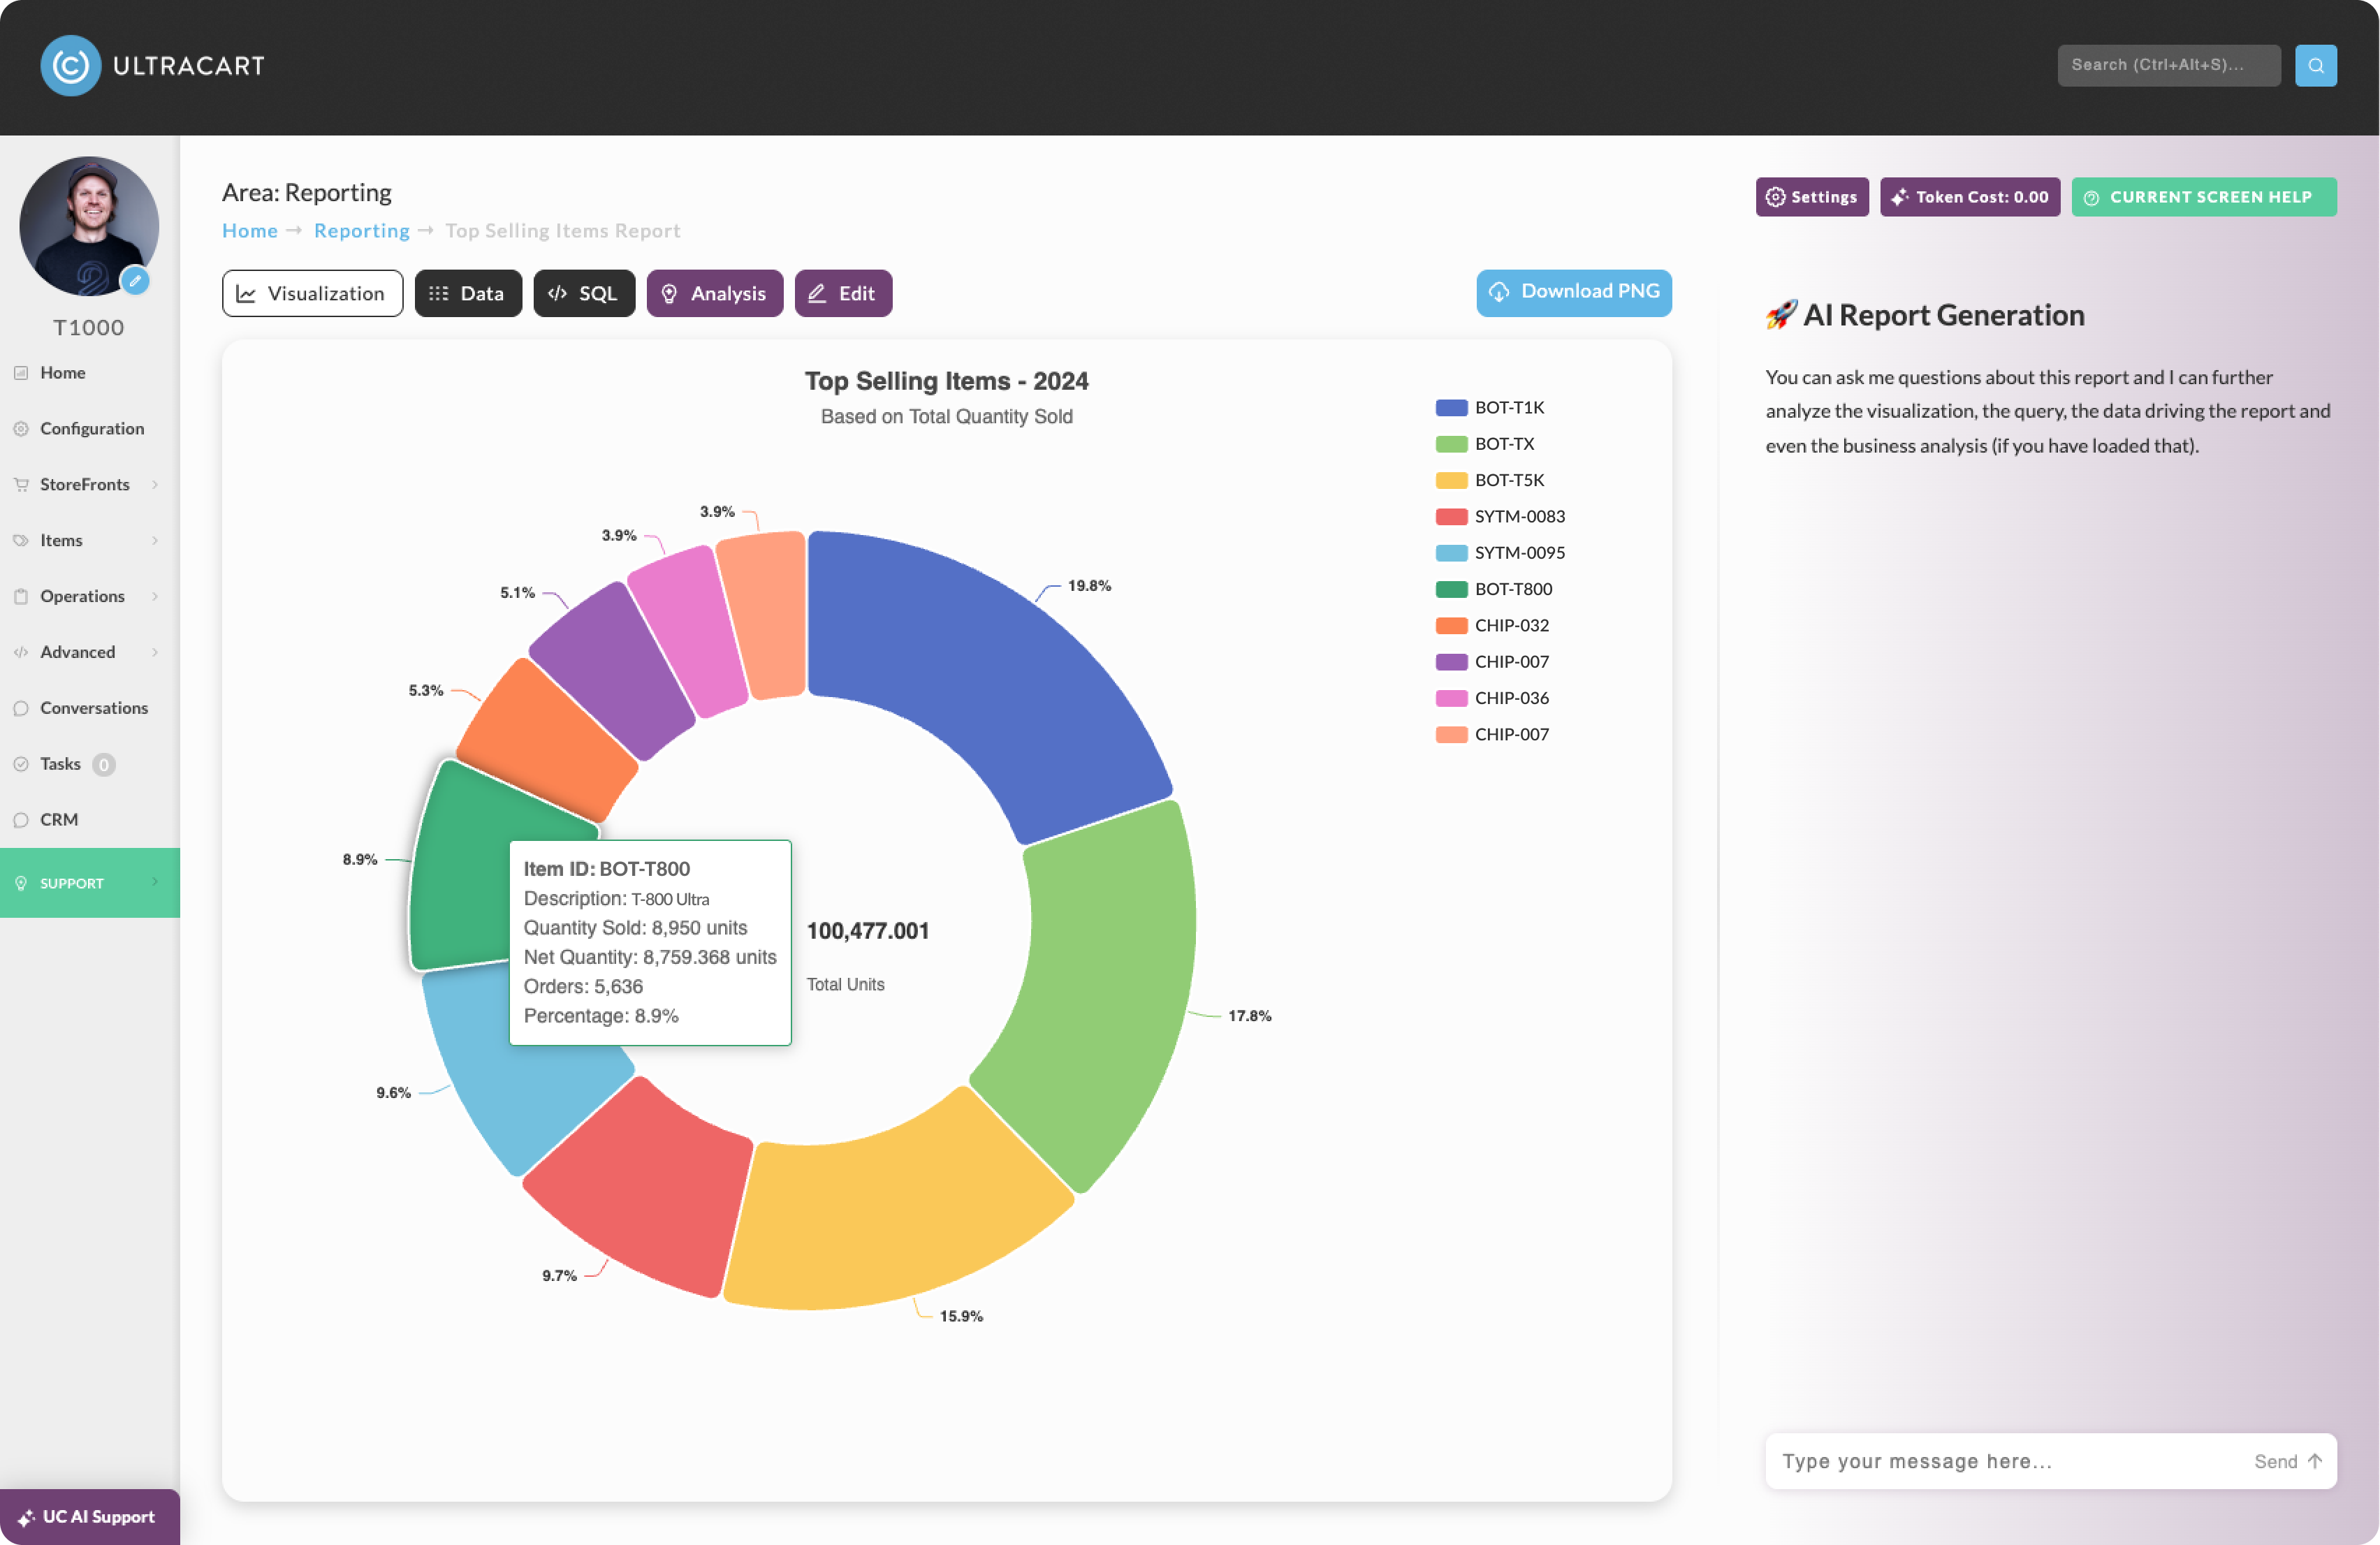
Navigate to the Viewer
-
Go to Operations → Reporting.
-
Open a report by either:
-
Selecting it from a Custom Group you created when generating reports, or
-
Clicking Build Custom Reports to see your list of generated reports (or to create a new one).
-
-
Click any report in the list to open it in the AI Report Viewer.
note
Tip: Use clear names and groups when saving reports so your team can quickly find them later.
Tip: Use clear names and groups when saving reports so your team can quickly find them later.
What you can do in the Viewer
Across the top of the viewer you’ll see tabs for each part of the report:
Visualization
View the chart the AI generated for your query (pie, bar, line, etc.).
-
Hover to see tooltips and segment values.
-
Click Download PNG to share the chart with colleagues or stakeholders.
Data
See the complete table that powers the visualization.
-
Inspect rows and columns to validate results.
-
Click Download Excel to export the dataset for offline analysis or sharing.
SQL
Review the exact SQL used to generate the data.
-
Great for learning how queries are structured or for adapting them to your own needs.
-
Copy the query with one click.
-
Parameters (e.g.,
start_date,end_date) are listed under the SQL so you can see the filters that were applied.
Analysis (contextual, not one-size-fits-all)
When a report is first generated, UltraCart also generates a report-specific analysis prompt tailored to that report’s SQL, parameters, dataset, and chart type. This means the AI isn’t using a generic template—it’s guided by context that’s unique to your report so the write-up focuses on the right dimensions, filters, and business questions.
What the contextual prompt captures
-
The timeframe and filters you chose (e.g., last 90 days, channel = Paid Social).
-
The aggregation and groupings in your SQL (e.g., by SKU, by category, by state).
-
The metrics present (units, net revenue, AOV, margin if available) and any parameters.
-
The visualization type (pie, bar, line) to align commentary with what you see.
Why it matters
-
Produces relevant insights (e.g., concentration, movers/decliners, promo effects) instead of generic commentary.
-
Surfaces actionable recommendations tied to your exact dataset.
-
Ensures consistency: when you Edit a report (change dates, dimensions, filters, metrics, or chart), the system regenerates the analysis prompt and updates the analysis to match the new context.
note
Tip: If you want the analysis to emphasize a theme (e.g., margin over units, retention over acquisition), click Edit and say so—your new prompt and analysis will reflect that priority.
Tip: If you want the analysis to emphasize a theme (e.g., margin over units, retention over acquisition), click Edit and say so—your new prompt and analysis will reflect that priority.
note
Tip: Use the AI Chat to ask follow-ups about anything the analysis mentions; the chat already has the same full context (data, SQL, visualization, parameters, and the generated analysis).
Tip: Use the AI Chat to ask follow-ups about anything the analysis mentions; the chat already has the same full context (data, SQL, visualization, parameters, and the generated analysis).
Edit
Iterate on the report without starting over.
-
Click Edit to re-engage the AI agent and describe what you want changed (date ranges, dimensions, filters, metrics, chart type, etc.).
-
The agent will regenerate SQL, visualization, and the analysis to match your instructions.
-
Save over the existing report or save as a new one to keep versions.
AI Chat (side panel)
The side-chat agent automatically inherits the full context of the open report—the data table, the exact SQL, the visualization, the filters/parameters (e.g., date range), and the AI analysis. That means you can ask about any of these without re-explaining. It can cite rows, sanity-check the query, interpret the chart, and expand on the written insights.
Great for
-
Explaining spikes/dips and identifying the drivers (SKU, channel, campaign, region, cohort).
-
Validating the SQL logic and suggesting safer filters or edge-case fixes.
-
Translating the chart/table into plain-English takeaways and next-step tests.
-
Producing quick comparisons (MoM/YoY, channel vs. channel, SKU vs. category).
-
Drafting short summaries you can paste into email/Slack.
note
Note: Chat won’t change the report by itself. If an answer requires different dimensions/metrics, click Edit and tell the agent what to adjust; it will regenerate the SQL, visualization, and analysis.
Note: Chat won’t change the report by itself. If an answer requires different dimensions/metrics, click Edit and tell the agent what to adjust; it will regenerate the SQL, visualization, and analysis.
Prompting tips
-
Be specific about metric, timeframe, dimension, and comparison.
Template: “Compare {metric} for {dimension} over {timeframe} vs {baseline}; return a ranked table and 3 insights.” -
Ask for the format you want: table, bullets, or a short paragraph.
-
If you need new fields, say so (“add COGS and gross margin”) and then use Edit to update the report.
Settings & Token Cost
Settings
Click Settings (top-right) to control how AI is used for custom reports.
-
Opt-in to custom reports and set a monthly AI Budget.
-
(Optional) Novice SQL Comments adds instructional comments to generated SQL.
-
Permissions: Changing budgets and some settings requires the Edit Service Plan permission in user configuration. If you see a message indicating you lack permission, contact your account admin.
Token Cost
Click Token Cost for full transparency into AI usage during your session.
-
Light model tokens are used for predictable tasks.
-
Heavy model tokens are used for deep reasoning and analysis.
-
You’ll see counts for Input, Output, and Cache reads/creates to understand where compute was spent.
Best practices
-
Name reports clearly (purpose, date range, primary metric) and group them so teams can find them.
-
Validate the data on the Data tab before sharing charts.
-
Use Edit for iteration: ask for new dimensions, filters, or chart styles in plain English.
-
Save as new when exploring big changes so you keep a clean history.
-
Leverage Analysis to turn findings into action items your team can test.