Navigation
Operations → Reporting → Auto Orders → Churn
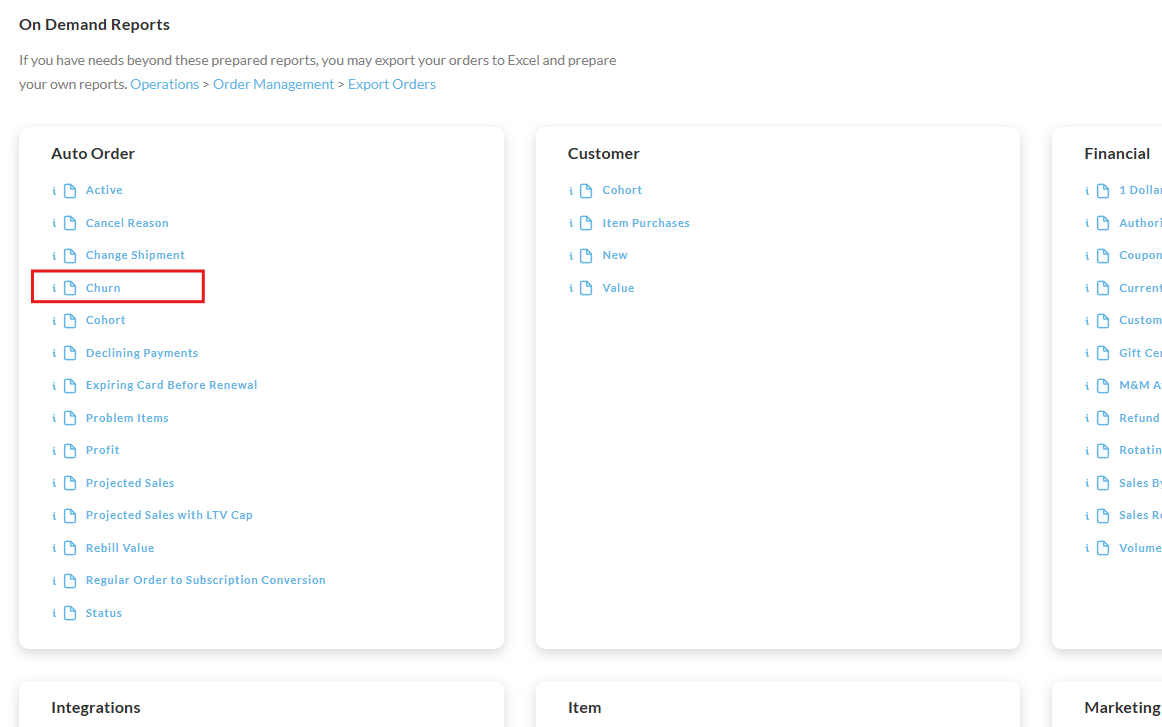
Overview
Simply click the Generate Report Button to view the report, there are no other settings or options.
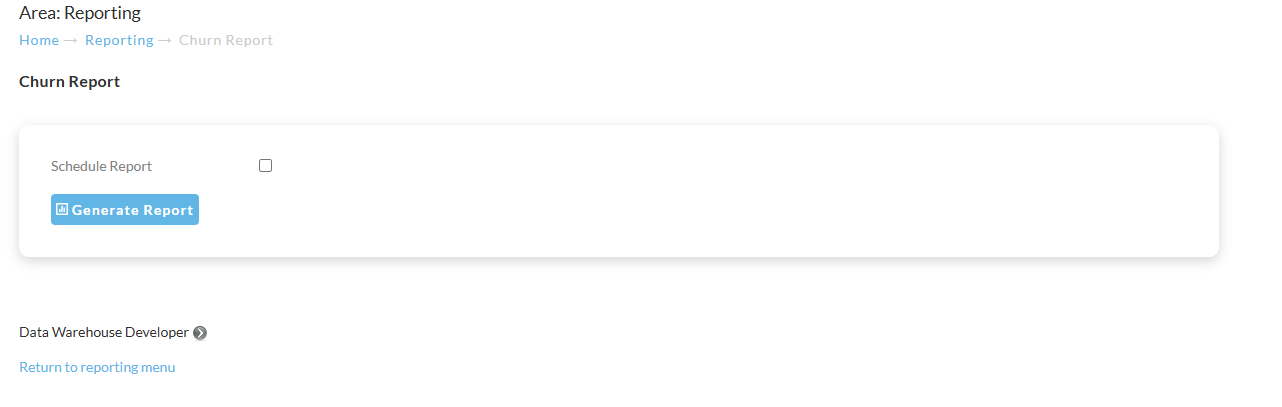
This report is schedule-able
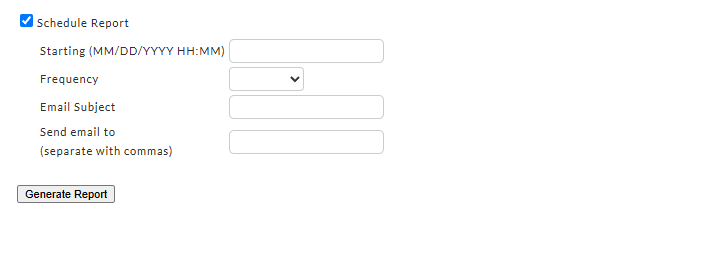
To schedule an automated report that is emailed to one or more email addresses, select the "Schedule report checkbox.
You'll then be presented with the report scheduler form:
What is customer churn?
Customer churn refers to the natural business cycle of losing and acquiring customers over a period of time. Every company experiences churn and generally speaking, the less churn you have, the more customers you keep.
What is a churn percentage?
Churn percentage, (i.e.- “attrition rate”), is the rate at which customers stop doing business with a company over a given period of time. Churn may also apply to the number of subscribers who cancel or don’t renew a recurring order. The higher your churn percentage, the more customers stop buying from your business. The lower your churn rate, the more customers you retain. Typically, the lower your churn rate, the better.
Churn Percentage Calculation
The Churn percentage column in UltraCart's Churn Report measures the rate at which active customers stop engaging with your store (or a specific item) during a given month. It is a key retention metric that helps identify potential issues in customer satisfaction, product value, or marketing effectiveness.
Formula
text
-
Results are rounded to two decimal places.
-
If Period starting active is zero, the churn percentage displays as a dash (-) to avoid division by zero.
-
If Churned in period is zero, the result is 0.00 (or - if no starting base exists).
Note: This is gross churn—it does not account for new additions during the period. For net growth analysis, compare Period ending active to Period starting active.
Common Dash (-) Scenarios
| Column Name | Description |
|---|---|
| Month | The specific month and year for the reporting period (format: MM/DD/YYYY). This serves as the timeline anchor for all metrics. |
| Period starting active | The number of active customers (e.g., subscribers or accounts) at the beginning of the month. This is the baseline for churn calculations. |
| Added in period | The number of new customers added during the month. This reflects acquisition efforts and contributes to net growth. |
| Churned in period | The number of customers who became inactive (churned) during the month. This is a key indicator of retention issues. |
| Column Name | Description |
| Column Name | Description |
|---|---|
| Month | The specific month and year for the reporting period (format: MM/DD/YYYY). Aligns with the timeline in the Overall Churn worksheet for cross-comparison. |
| Period starting active | The number of customers active with this specific item at the beginning of the month. This is the baseline for item-specific churn calculations. |
| Added in period | The number of new customers who became active with this item during the month (e.g., new subscriptions or purchases). A dash (-) indicates zero or no data. |
| Churned in period | The number of customers who stopped being active with this item during the month (e.g., canceled subscription, no repeat purchase). A dash (-) indicates zero churn. |
| Period ending active | The total number of customers active with this item at the end of the month. Calculated as: Period starting active + Added in period - Churned in period. |
| Churn percentage | The churn rate for this item in the month, expressed as a percentage. Calculated as: (Churned in period / Period starting active) × 100. Rounded to two decimal places. A dash (-) appears when the starting count is zero or no churn occurred. |
| Outcome | A qualitative trend indicator: "growing" if Period ending active > Period starting active, "shrinking" if less, or blank if stable. Helps quickly spot retention momentum. |
Note: Dashes (
-) are used instead of0or blank cells to clearly distinguish "no activity" from "zero change." This improves readability in exported reports.
Tip: Use the Return to index hyperlink (top-left) to navigate back to the Item List worksheet. Compare Churn percentage across multiple item worksheets to identify high-retention vs. high-churn products.
For deeper analysis, export item-level data and build cohort retention charts in tools like Excel or Google Data Studio. Refer to the Overall Churn Worksheet for aggregate benchmarks and the Item List Worksheet to select items for review.