Navigation
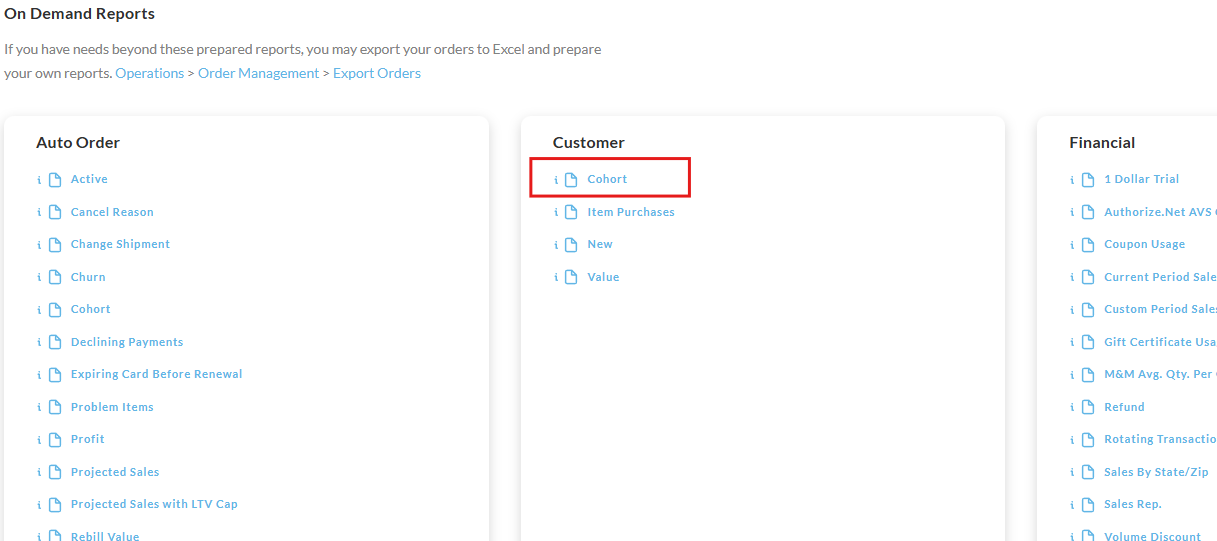
Operations → Reporting → Customer → Cohort
What is a Cohort?
Cohort - a group of people banded together or treated as a group.
Overview
The Cohort Customer report groups customers by time periods and shows how those customers behaved following their initial purchase. It helps answer these business questions such as:
-
What is the lifetime value of customers who purchased more than 12 months ago?
-
Is that particular Facebook campaign profitable?
-
What is the quality of the traffic generated by a particular affiliate?
-
Can I afford to pay a particular affiliate more if they demand it?
-
What percentage of my auto order (recurring) customers remain after 90 days?
Running the Report
When you get to this page you'll see the following screen:
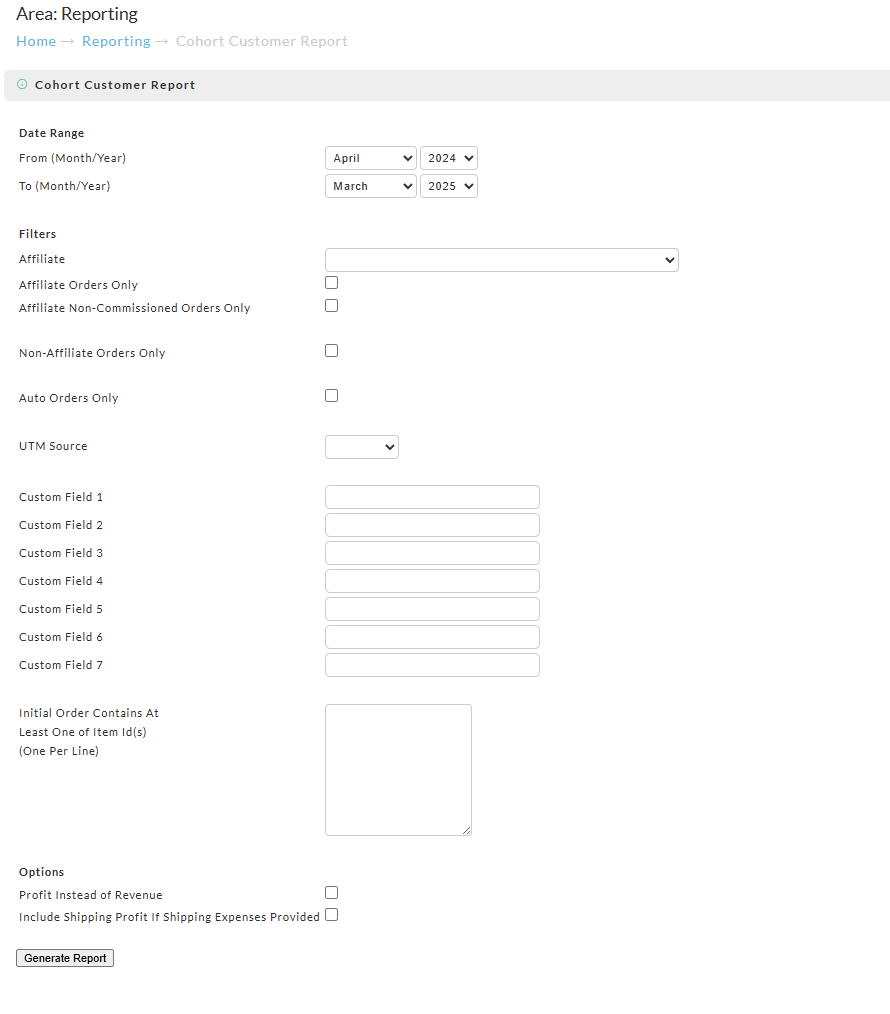
The report will default to the last 12 calendar months. You can run this report for any time period, but customers are grouped into monthly cohorts.
Default Customers
The default customers included in the report are new customers that have never purchased before the start date that the report is run.
There are a number of filter options that you can use which will change the type of customers included in the report:
| Filter | Description |
|---|---|
| Affiliate | Run the report for a specific affiliate. Only customers where the first order is from that particular affiliate are shown in the report and then subsequent orders by those customers (regardless of whether the affiliate received commission on the subsequent orders). |
| Affiliate Orders Only | Runs the report for only customers where the first order was attributed to an affiliate. |
| Non-Affiliate Orders Only | Runs the report for customers where no affiliate was involved on the original order. |
| Tab | Description |
|---|---|
| Instructions | Provides a link to this documentation. |
| Cumulative Analysis | This view will show you how each cohort of customers performs cumulatively over time. Each time period is contains cumulative values. |
| Monthly Analysis | This view shows how the customers in each cohort perform over each monthly time period since their first order. |
| Churn Analysis (auto orders only report) | This shows the attrition of customers that signed up for the auto order in the cohort and when they dropped off. |
| MRR Data | The raw data that all of the formulas in the spreadsheet are calculating off of. If you disagree with an answer in the report, you can review the underlying raw data. |
| Auto Orders | This tab appears for merchants with auto orders. |
Cumulative Analysis
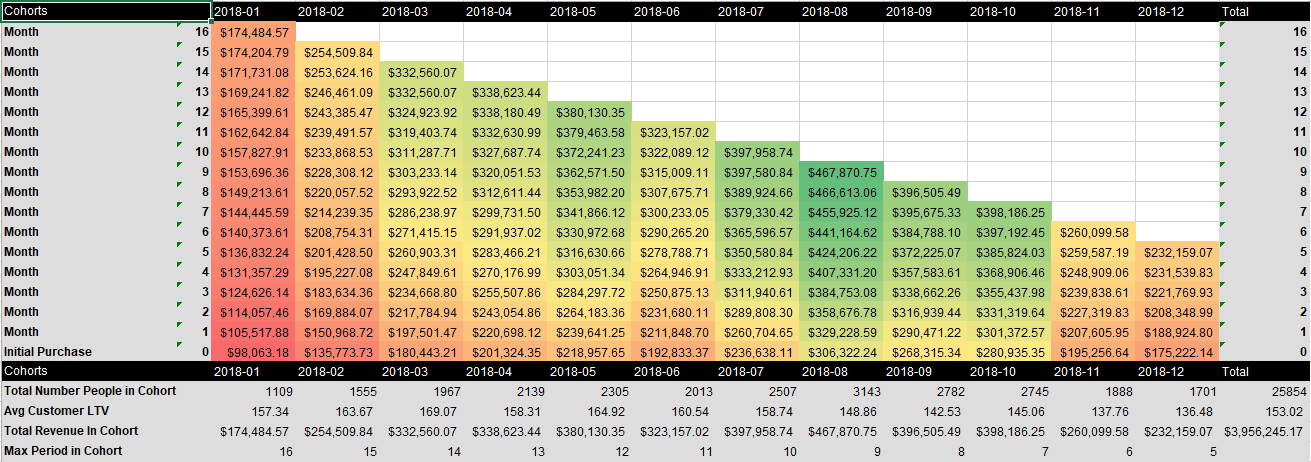
Across the top are each month as a Cohort. The months are shown in YYYY-MM format. Within each column are the initial purchases of the months above. The older the cohort the more likely that those customers have purchased again and again thus the number of months will increase. In the cumulative analysis view the very top number in the column is the total for that cohort. Down at the bottom of the spreadsheet there are statistics about the over all cohort.
| Statistics | Description | How its totaled |
|---|---|---|
| Total Number of People in Cohort | The number of customers contained within the cohort. | Sum of all the customers across all the cohorts |
| Avg Customer LTV | Average customer life time value. | Sum of the revenue / Sum of all the customers across all the cohorts |
| Total Revenue in Cohort | Total revenue in the cohort. | Sum of the revenue |
| Max Period in Cohort | The maximum number of periods (months) for the customers contained within the cohort | n/a |
Monthly Analysis
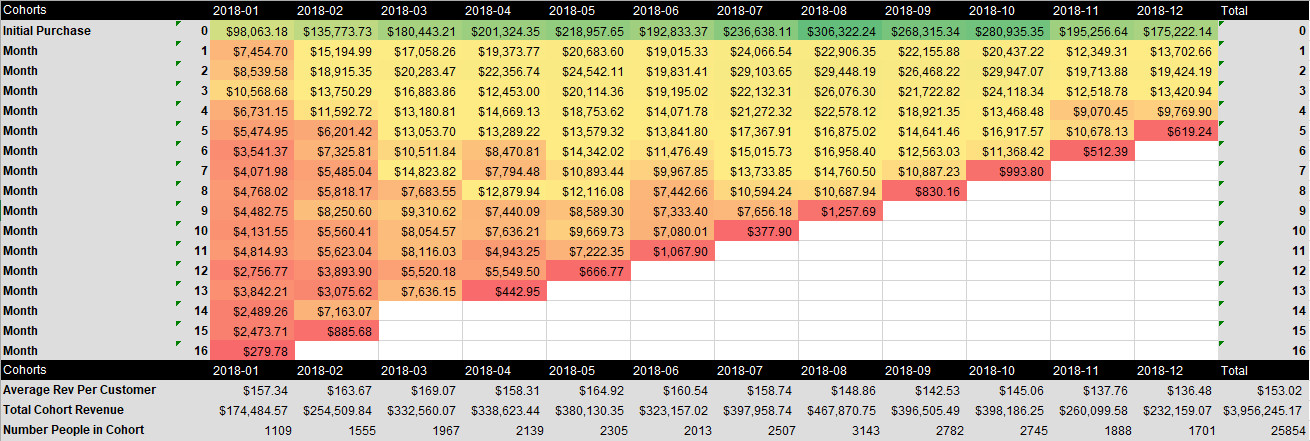
Across the top you will see that each month is a Cohort. You'll see the label in YYYY-MM format. Within each column you will see the initial purchase and then the months below. The older the cohort the more likely that those customers have purchased again and again thus the number of months will increase. In the monthly analysis view each cell contains the revenue for that particular cohort within the month. Down at the bottom of the spreadsheet there are statistics about the over all cohort.
| Statistics | Description | How its totaled |
|---|---|---|
| Average Rev. Per Customer | Average revenue per customer within the cohort. | Sum of the revenue across the cohorts. / Sum of the customers across all cohorts. |
| Total Cohort Revenue | Total revenue in the cohort. | Sum of the revenue across the cohorts. |
| Number People in Cohort | The number of people in the cohort. | Sum of the customers across all cohorts. |
Churn Analysis
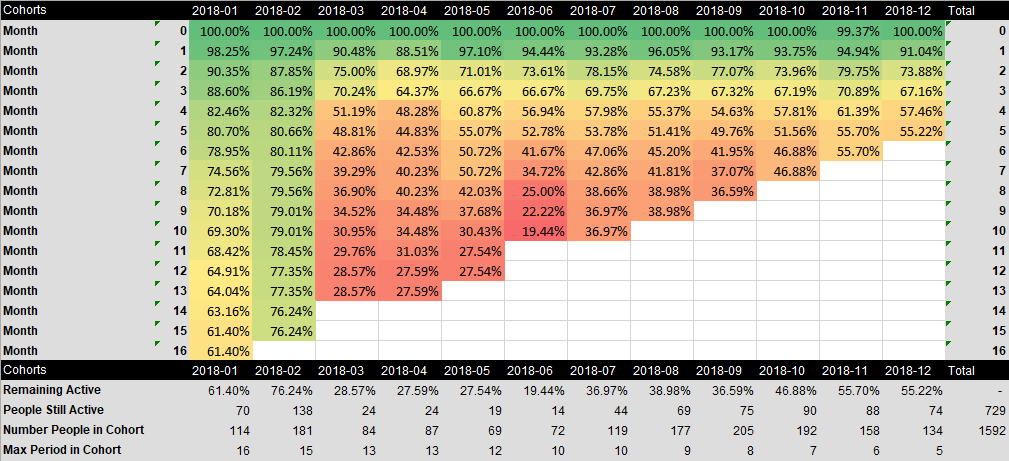
The churn analysis report shows the percentage of customers that remain active on their auto order as each month goes along. This reports how each cohort behaves from a retention perspective over time.
| Statistics | Description | How its totaled |
|---|---|---|
| Remaining Active | Percentage of customers that remain active within the cohort. | n/a |
| People Still Active | Number of people still active within the cohort. | Sum of the people still active across the cohorts |
| Number People in Cohort | Number of people that signed up for an auto order in the cohort. | Sum of the people across the cohorts |
| Max Period in Cohort | The maximum number of periods (months) for the customers contained within the cohort. | n/a |