Introduction
The Landing Page Report provides insight into how visitors interact with your storefront landing pages. It helps you evaluate marketing performance, identify high-converting pages, and optimize traffic sources.
This report is especially useful for analyzing campaign effectiveness when using UTM parameters and understanding how different landing pages contribute to revenue and conversions.
Tip: For more advanced or customized reporting, consider using the AI-powered Report Builder to generate tailored landing page analytics and visualizations. ucdoc-AI-Powered Report Builder…
Navigation
To access the Landing Page Report:
Operations → Reporting → (Storefronts section) Landing Page
Prerequisites
Before running this report, ensure:
-
Your storefront is actively receiving traffic
-
UTM tracking is configured (optional, but recommended for campaign analysis)
-
You have appropriate reporting permissions in UltraCart
Running the Report
-
Navigate to Operations → Reporting → Landing Page
-
Enter the following fields:
-
Start Date
-
End Date
-
-
(Optional) Select a UTM Source from the dropdown
-
Click Generate Report
Note: Some reports may process asynchronously depending on the date range and data volume. If so, retrieve the file from Report Pickup.
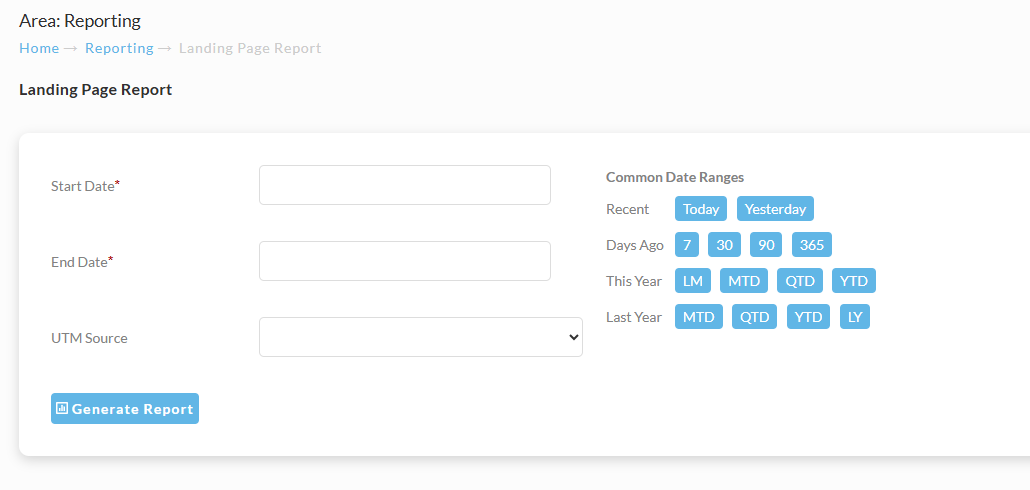
To run the report, enter the Start and End Dates, and optionally, select a UTM source from the drop-down menu. Next, click the Generate Report button.
Generate Report Fields
| Field | Type | Required | Description |
|---|---|---|---|
| Start Date | Date | Yes | The beginning date for the reporting period. Data prior to this date will not be included. |
| End Date | Date | Yes | The ending date for the reporting period. Data after this date will not be included. |
| UTM Source | Dropdown | No | Filters results by a specific UTM source (e.g., Google, Facebook, Email campaigns). Useful for analyzing marketing channel performance. |
Report Output
-
The generated file will be named:
landingPageReport.xlsx -
The report is downloaded directly or made available via Report Pickup depending on processing time.
Report Fields and Definitions
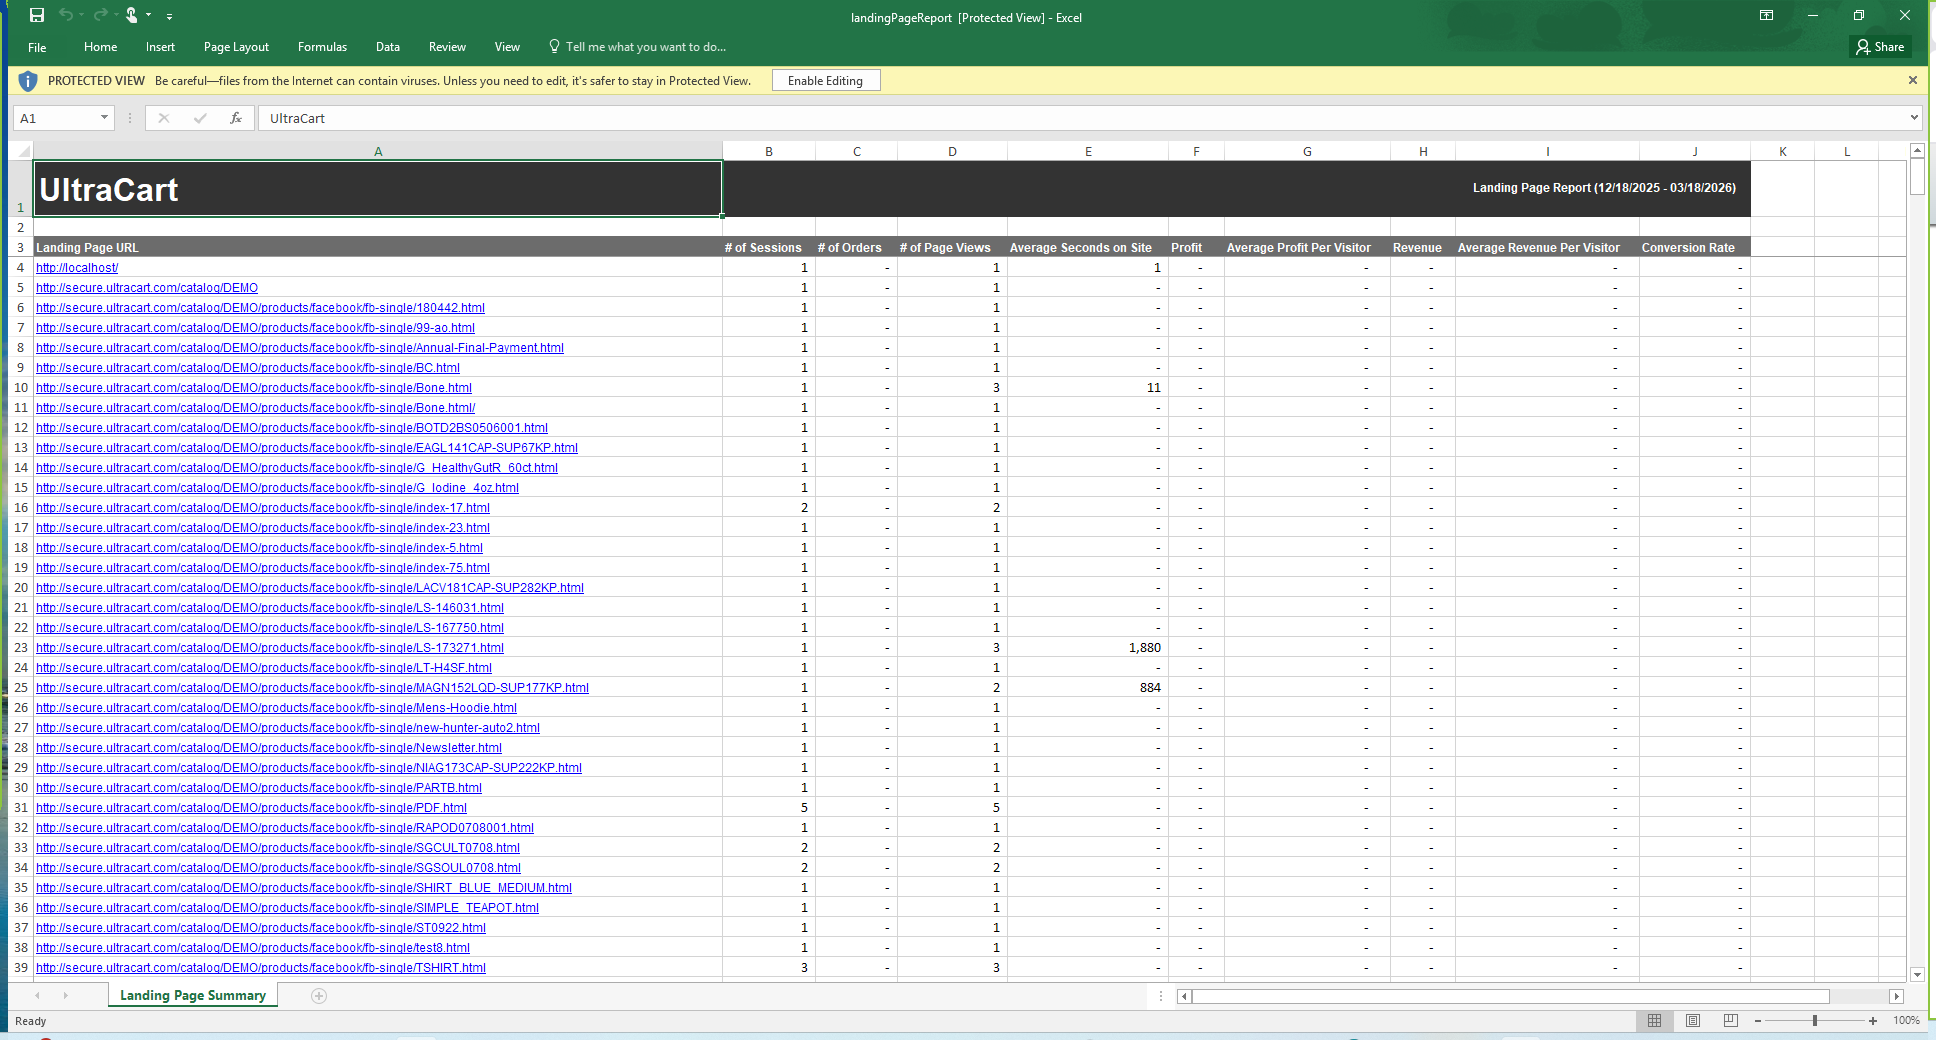
The report spreadsheet contains the following columns:
| Field | Description |
|---|---|
| Landing Page URL | The URL of the page where the visitor first entered your storefront session. |
| # of Sessions | The total number of unique sessions that began on this landing page. |
| # of Orders | The total number of completed orders originating from sessions that started on this landing page. |
| # of Page Views | The total number of page views generated by sessions that began on this landing page. |
| Average Seconds on Site | The average time (in seconds) visitors spent on the site during sessions that started on this landing page. |
| Profit | The total profit generated from orders attributed to this landing page (after costs). |
| Average Profit Per Visitor | The average profit generated per session (Profit ÷ # of Sessions). |
| Revenue | The total revenue generated from orders attributed to this landing page. |
| Average Revenue Per Visitor | The average revenue per session (Revenue ÷ # of Sessions). |
| Conversion Rate | The percentage of sessions that resulted in an order (# of Orders ÷ # of Sessions). |
How to Use This Report
Use the Landing Page Report to:
-
Identify high-performing landing pages
-
Compare conversion rates across campaigns
-
Evaluate traffic quality by UTM source
-
Optimize ad spend and marketing funnels
-
Improve on-site engagement and user experience
Conclusion
The Landing Page Report provides essential visibility into how visitors enter and interact with your storefront. By understanding which pages drive engagement and conversions, you can make informed decisions to improve marketing performance and increase revenue.
Next Steps
-
Use the AI Report Builder to create advanced landing page segmentation (e.g., by device, geography, or campaign)
-
Combine this report with UTM tracking for deeper campaign attribution
-
Explore additional reports in Operations → Reporting for broader performance insights
-
Consider building a custom dashboard to monitor landing page KPIs over time