Overview
This is a multi-touch attribution report. It distributes revenue credit across the UTM touches that led up to each order, using a month-long lookback window to pull in prior non-converting sessions from the same visitor.
Key behaviors to understand before reading the report:
-
For each visitor whose most recent session falls in the selected date range, the report pulls in non-converting sessions from up to one month prior.
-
All UTM touches from qualifying sessions are concatenated into a single record per visitor, capped at 5 touches.
-
Revenue from a conversion is split across those touches using a position-based weighting model (see “How the Attribution Model Works” below).
-
total_click_countcounts attribution touches, not unique clicks or unique visitors. One visitor with three UTM-tagged sessions contributes three to this count.
This report is not designed for comparison against ad platform click counts (Google Ads, Facebook Ads, etc.). The numbers here are multi-touch attribution touches inside UltraCart's session data, not raw ad-platform clicks, and they will not match.
For volume comparison against ad platforms, use the UTM Unique Clicks report, which counts distinct visitors by UTM source.
Learn about UTM here: https://en.wikipedia.org/wiki/UTM_parameters
How the Attribution Model Works
Month lookback window
For each visitor whose most recent session falls in the selected date range, the report pulls in non-converting sessions from up to one month prior. Those prior sessions do not need to fall inside the date range themselves — they are attached to the most-recent-session anchor.
UTM concatenation
All UTM touches from qualifying sessions for a visitor are merged into a single record, ordered newest to oldest and capped at five touches. Click 1 is the most recent (conversion click); Click N is the oldest (top of funnel).
Weighted revenue allocation
Order revenue is split across the visitor's UTM touches using a position-based model. First and last touches get the heaviest weight; middle touches get token credit.
| Touch count | Click 1 (most recent) | Click 2 | Click 3 | Click 4 | Click 5 (oldest) |
|---|---|---|---|---|---|
| 1 touch | 100% | — | — | — | — |
| 2 touches | 50% | 50% | — | — | — |
| 3 touches | 40% | 20% | 40% | — | — |
| 4 touches | 40% | 10% | 10% | 40% | — |
| 5 touches | 40% | 6.6% | 6.6% | 6.6% | 40% |
Because revenue is fractional, the same order's revenue appears across multiple UTM rows at different weights. Summing weighted_revenue across all rows of a source/campaign slice will recover the full order revenue.
How to Interpret This Report
Questions this report answers well:
-
Which marketing channels contributed to revenue, and how should credit be distributed across them?
-
How does revenue attribution change when you account for prior touches vs. just the last click?
-
Which campaigns are appearing in the top-of-funnel vs. closing position for converters?
Questions this report does not answer:
-
“How many people clicked my Google ad today?” — use the UTM Unique Clicks report or your ad platform directly.
-
“How many unique visitors did UTM source X drive?” — same; this report counts attribution touches, not visitors.
-
“What is the revenue per click?” — dividing
weighted_revenuebytotal_click_counthere mixes attribution touches with revenue fractions, so the result is not meaningful as cost-per-click. Use unique visitor counts instead.
Date Range Behavior
-
The report looks back up to one month before the start date for historical (non-converting) sessions. Those earlier sessions are attached to the visitor's most-recent session, which is the anchor for inclusion.
-
The underlying query uses
CURRENT_DATETIME, so results can shift slightly depending on when the report is run, even for the same date range. -
Dates are converted from Eastern time to UTC during querying, so day boundaries may not align exactly with other platforms that report in local time.
Report Details
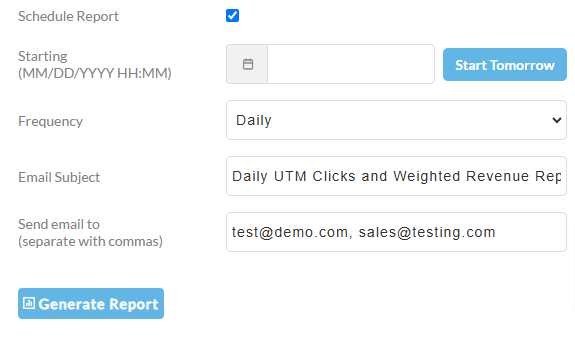
Optional Scheduling Report settings (Click the ‘Schedule Report’ for scheduling options.)
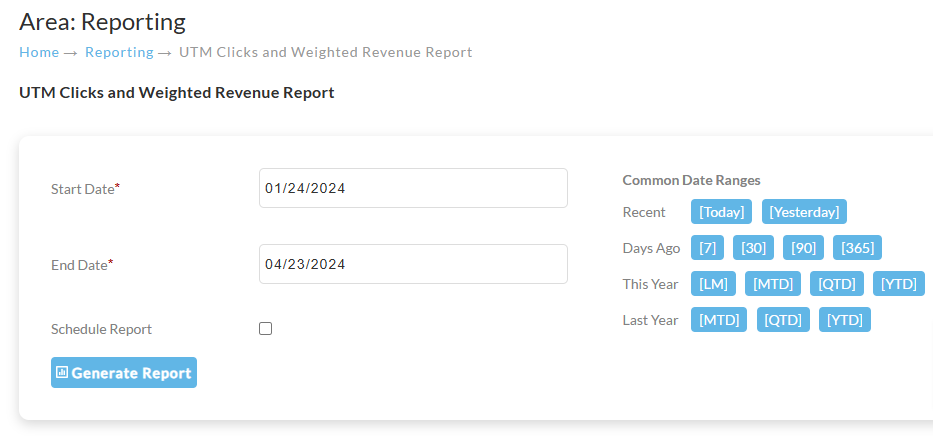
This report has two configurable options:
-
Date Range
-
Schedule Report
Report Worksheet and Column Descriptions
The report is composed of 4 worksheets:
-
source_campaign_and_term
-
source_and_campaign
-
source
-
per order
Source_campaign_and_term Columns
Each row is a single order, with the order's UTM touches expanded across up to five click slots (click 1 = most recent touch, click 5 = oldest).
| Column | Description |
|---|---|
| order_id | Order ID |
| total_clicks | Total clicks related to the order |
| total | Total revenue for the order |
| creation_dts | Creation date/time of the order |
| utm_source1 | Click source (most recent touch) |
| utm_campaign1 | Click campaign |
| utm_term1 | Click term |
| ts1 | Click timestamp |
| click_weight1 | Click weight (percent of the revenue allocated to the click) |
| click_revenue1 | Click revenue (total multiplied by the weight) |
| utm_source2 … click_revenue5 | The same six fields — utm_source, utm_campaign, utm_term, ts, click_weight, click_revenue — repeat for click slots 2 through 5, each describing the next-oldest touch. Slots beyond the visitor's actual touch count are left blank. |
Source_and_campaign columns
| Column | Description |
|---|---|
| utm_source | Source |
| utm_campaign | Campaign |
| weighted_revenue | Amount of Weighted Revenue. This column represents the total revenue allocated to each source or campaign, taking into account the weight or percentage of revenue attributed to each click. This allows for a more accurate measurement of the revenue generated by each source or campaign, rather than just counting the number of clicks or conversions |
| total_click_count | Total number of UTM attribution touches for this source/campaign grouping. Counts each touch in the attribution model as a separate entry — a single visitor with 3 UTM-tagged sessions in the past month contributes 3 to this count, not 1. This number is typically significantly higher than unique visitor counts or ad-platform click counts. |
| conversion_click_count | Count of “last touch” attribution entries (click_index = 1, the most recent session) for this grouping. Every visitor has a click 1 regardless of whether they converted, so this is not a count of actual conversions — it is the number of visitors whose most recent touch matches this source/campaign. |
| middle_of_funnel_click_count | Count of touches that are neither the oldest nor the most recent in the attribution chain. Only populated for visitors with 3 or more touches; visitors with 1 or 2 touches contribute 0 here. |
| top_of_funnel_click_count | Count of the oldest touch in the attribution chain for this grouping. Only populated for visitors with 3 or more touches (click_index > 1 AND click_index = total_clicks); visitors with only 1 or 2 touches contribute 0 here. Includes non-converting visitors. |
Source worksheet columns
| Column | Description |
|---|---|
| utm_source | Source |
| weighted_revenue | Amount of Weighted Revenue |
| total_click_count | Total number of UTM attribution touches for this source. See the Source_and_campaign table above for the full definition. |
| conversion_click_count | Count of last-touch (most recent) attribution entries for this source. Not a count of actual conversions — see the Source_and_campaign table above. |
| middle_of_funnel_click_count | Middle-of-chain touches. Only populated for visitors with 3+ touches. |
| top_of_funnel_click_count | Oldest-touch attributions. Only populated for visitors with 3+ touches. |
Per order worksheet columns
The Per order worksheet uses the same column layout as Source_campaign_and_term Columns above: one row per order, with the order's UTM touches expanded across five click slots (utm_source1 … click_revenue5, click 1 = most recent).
Related Reports
Pick the report that matches the question you are answering:
-
UTM Clicks and Weighted Revenue (this report) — multi-touch attribution modeling, understanding the full customer journey, distributing revenue credit across channels.
-
UTM Unique Clicks — comparing against ad-platform click counts, counting unique visitors by UTM source.
-
Landing Page Report — session-level analysis, page views, bounce rates.
Customization
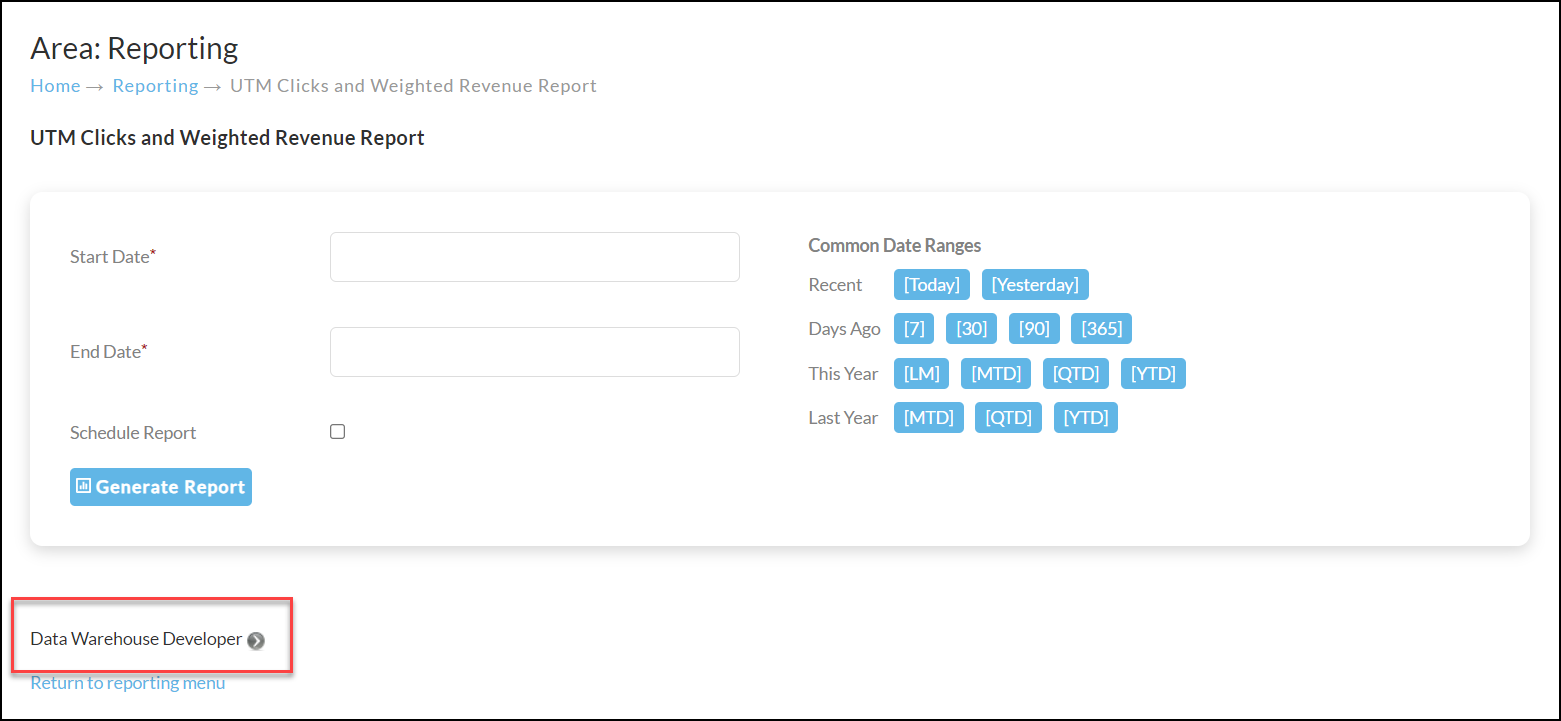
This report is built on the BigQuery Data Warehouse. The source SQL for each worksheet tab is visible by clicking the Data Warehouse Developer section of the report screen, and can be used as a starting point for custom reports.
Key tables used by this report:
-
uc_analytics_sessions— session-level UTM and click data, with visitor identity and timestamps. -
uc_orders— order-level revenue, joined to the session anchor for revenue allocation.
Custom report SQL can be registered in your account and will appear alongside the standard reports in the reporting UI. Every merchant's marketing reporting needs are different; writing custom SQL against BigQuery using tools like Google Looker (Data Studio) or Microsoft Power BI is how you unlock the full value of your data.
If you would like to hire someone to build BigQuery reports for you, please contact ScaleLean: